How to use Google’s free website analytics tool on your website

So you just got your brand new site from your web designer and you are ready to go out and make millions, but how do you know if your site is ready for the world?
Luckily Google has included a powerful and honestly under-used tool built right into the Chrome Browser to do a diagnostic of your site for free!
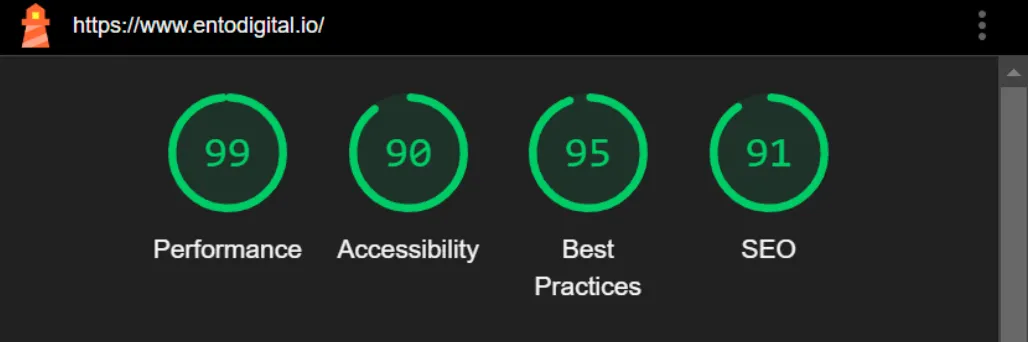
We are going to save you the fees with this because the SEO tools we use are pricey and complicated. This overview of how your site currently sits can guide your designer or developer to any problematic elements that need to be fixed, or you can get in touch with EntoDigital today and we'll do it all for you. Every site we build gets passing scores right after launch. As you can see below, even our complete refresh of this very site is all GREEN and ready to go!
Luckily Google has included a powerful and honestly under-used tool built right into the Chrome Browser to do a diagnostic of your site for free!
We are going to save you the fees with this because the SEO tools we use are pricey and complicated. This overview of how your site currently sits can guide your designer or developer to any problematic elements that need to be fixed, or you can get in touch with EntoDigital today and we'll do it all for you. Every site we build gets passing scores right after launch. As you can see below, even our complete refresh of this very site is all GREEN and ready to go!
No more mysteries about what your designer or developer has done for your site, you can check it all for yourself.
Let’s get started!
Let’s get started!
1. Now, you can’t just jump right into the tool to get accurate results because we all have various tools, plug-ins, and more running on our browsers.
To get the most accurate results, you need to open an Incognito Window in Chrome, which will give Lighthouse the most clean version of your site to analyze.
Do this by clicking the three vertical dots in the upper right corner under the close (X) button and then clicking New Incognito window. You can do this by pressing Ctrl+Shift+N on your Windows keyboard. You will know you made it when you are face-to-face with this sneaky little guy:

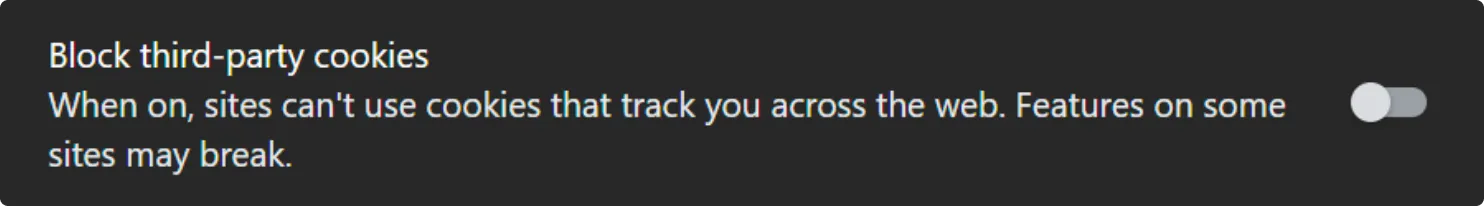
2. Once you have an Incognito Window open (it all sounds and looks so mysterious, doesn’t it?) enter your URL to get to your site’s homepage. If your site requires cookies to function properly, make sure this option is turned off before going to your site:
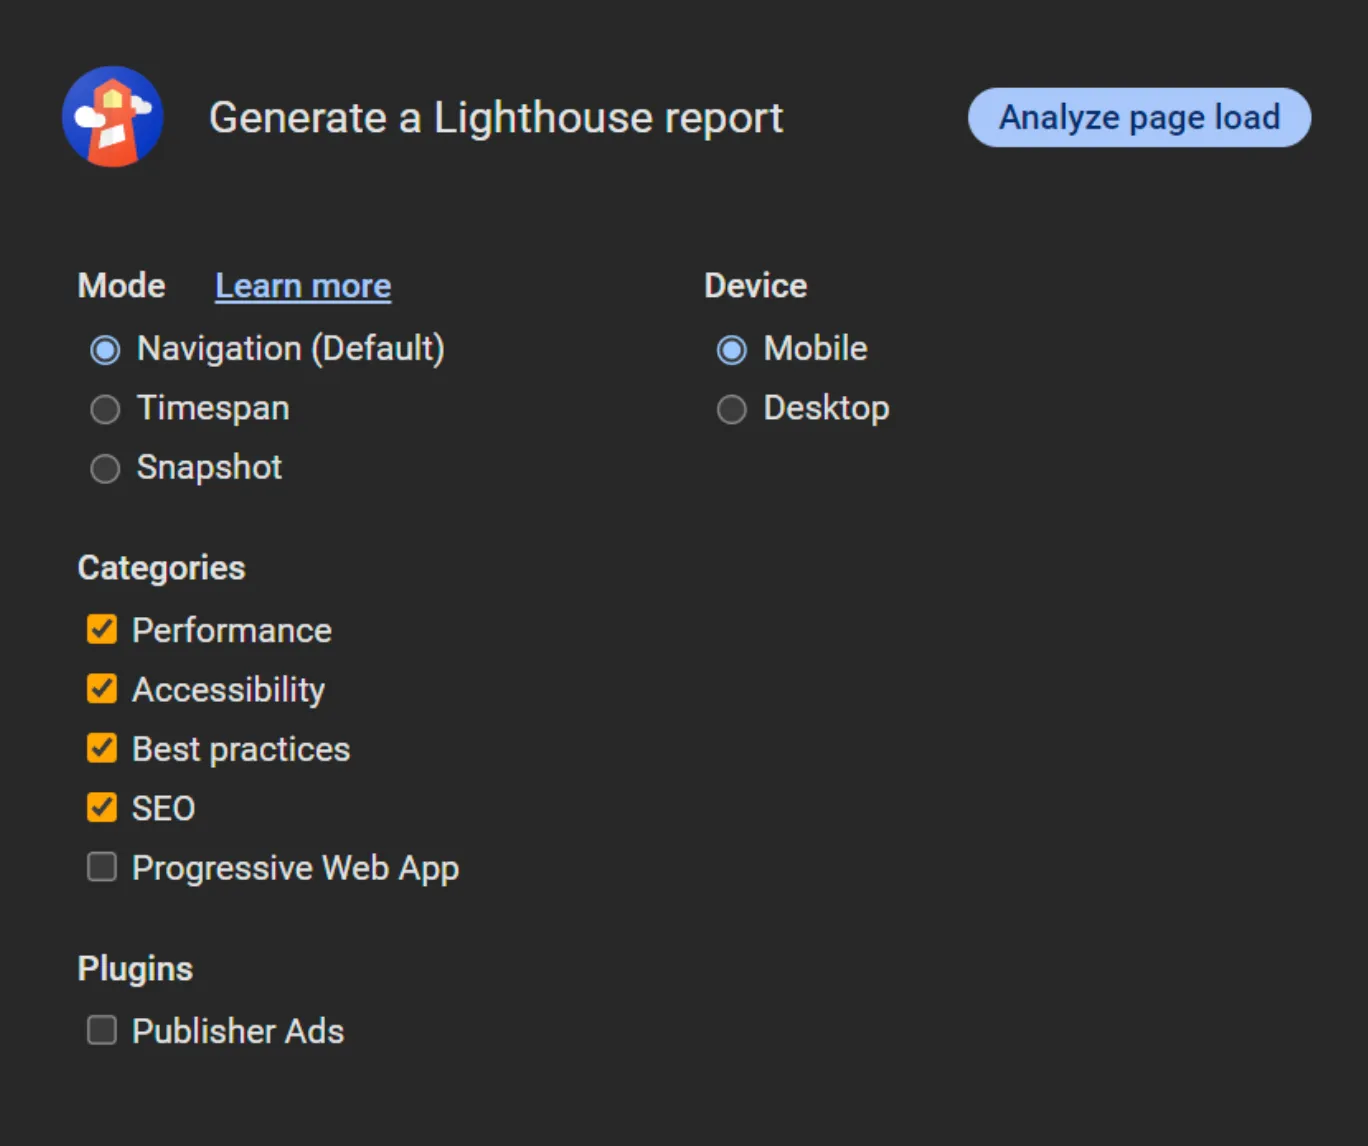
3. With your site open, click on the three vertical dots in the upper right corner again and go down to More tools, then click Developer tools. The shortcut for this one is Cntrl+Shift+I on Windows. Doing this will open a side panel filled with a bunch of code. At the top are two arrows pointing to the right. Click the >> to open a menu and choose Lighthouse. You will know you have made it there when you see this:
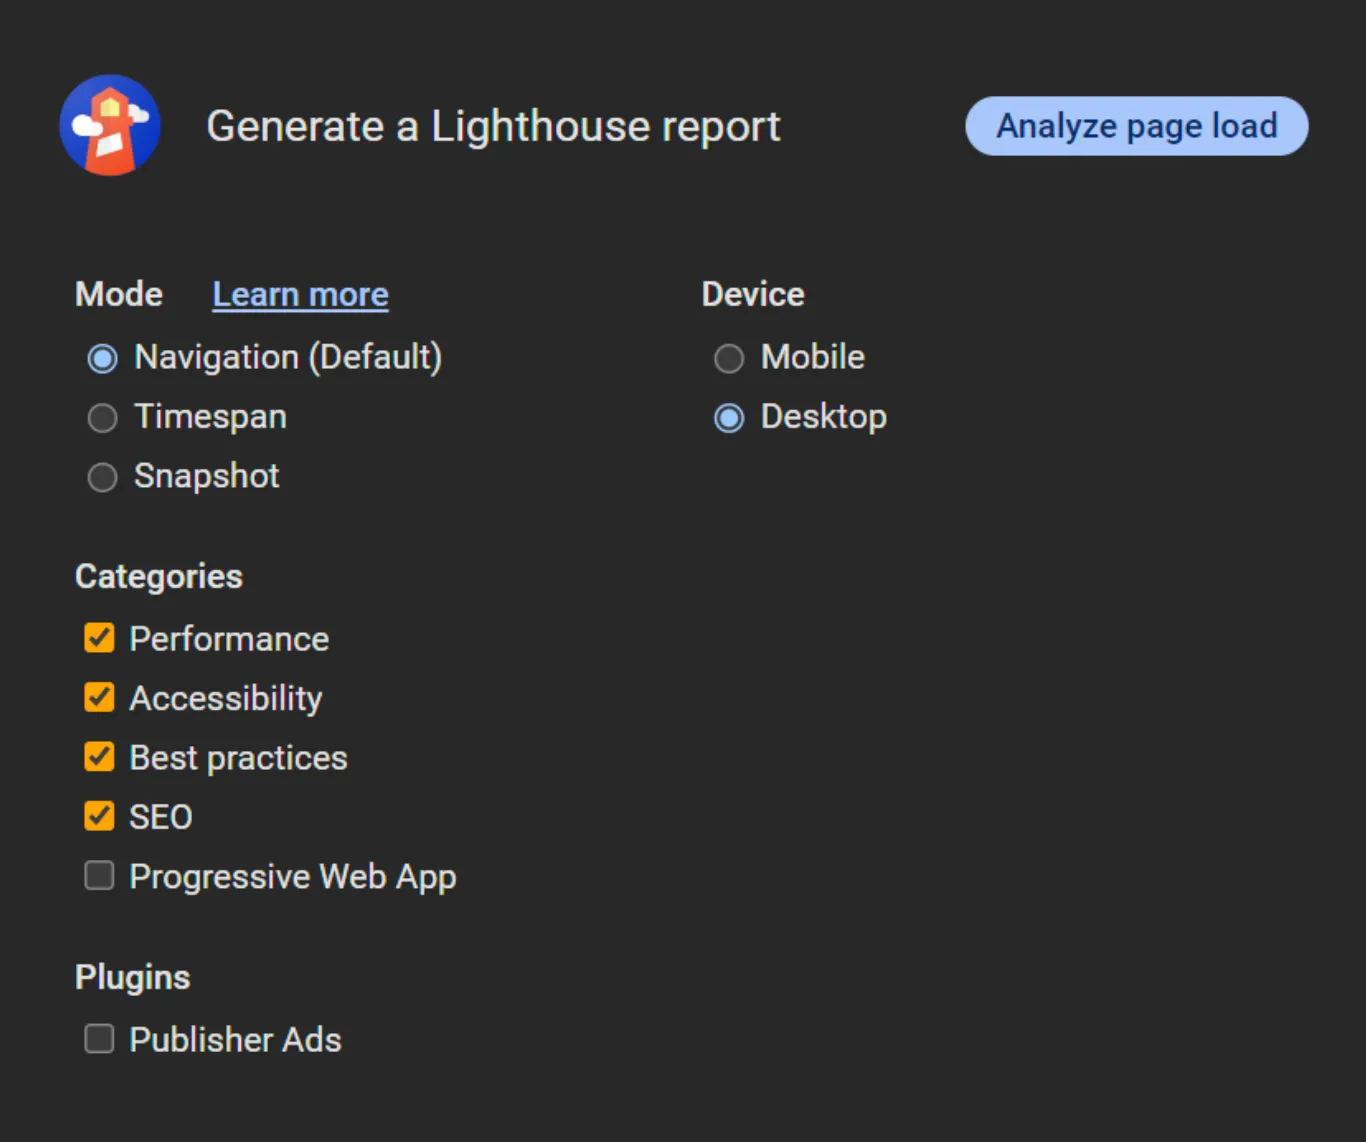
It is highly recommended that you click Progress Web App to remove it from Lighthouse reports, since we are checking websites, and the report for a PWA will give you a big discouraging RED score, because that isn’t what your site is at all. With everything else at their default settings let’s check out your Desktop report first. Click Analyze page load to see what the report says about your site!
4. If your designer or developer did their jobs efficiently, you should see all GREEN scores across the board. They don’t have to be 100s by any means, but as long as they are GREEN, your site is making Google happy, which means your visitors will also be happy. This is just the beginning though, and of course only an ideal situation. What if your site comes back with ORANGE, or even worst, RED scores? Google Lighthouse provides suggestions to make the appropriate fixes to get those scores higher.
Let’s look at some of the advice that Google gives to make sure your site is all good to go!
5. Starting at the top with Performance, scrolling down, you will see a section called Diagnostics, which lists even the smallest improvements you can make to get better site performance. Have a look at EntoDigital’s Diagnostics below:
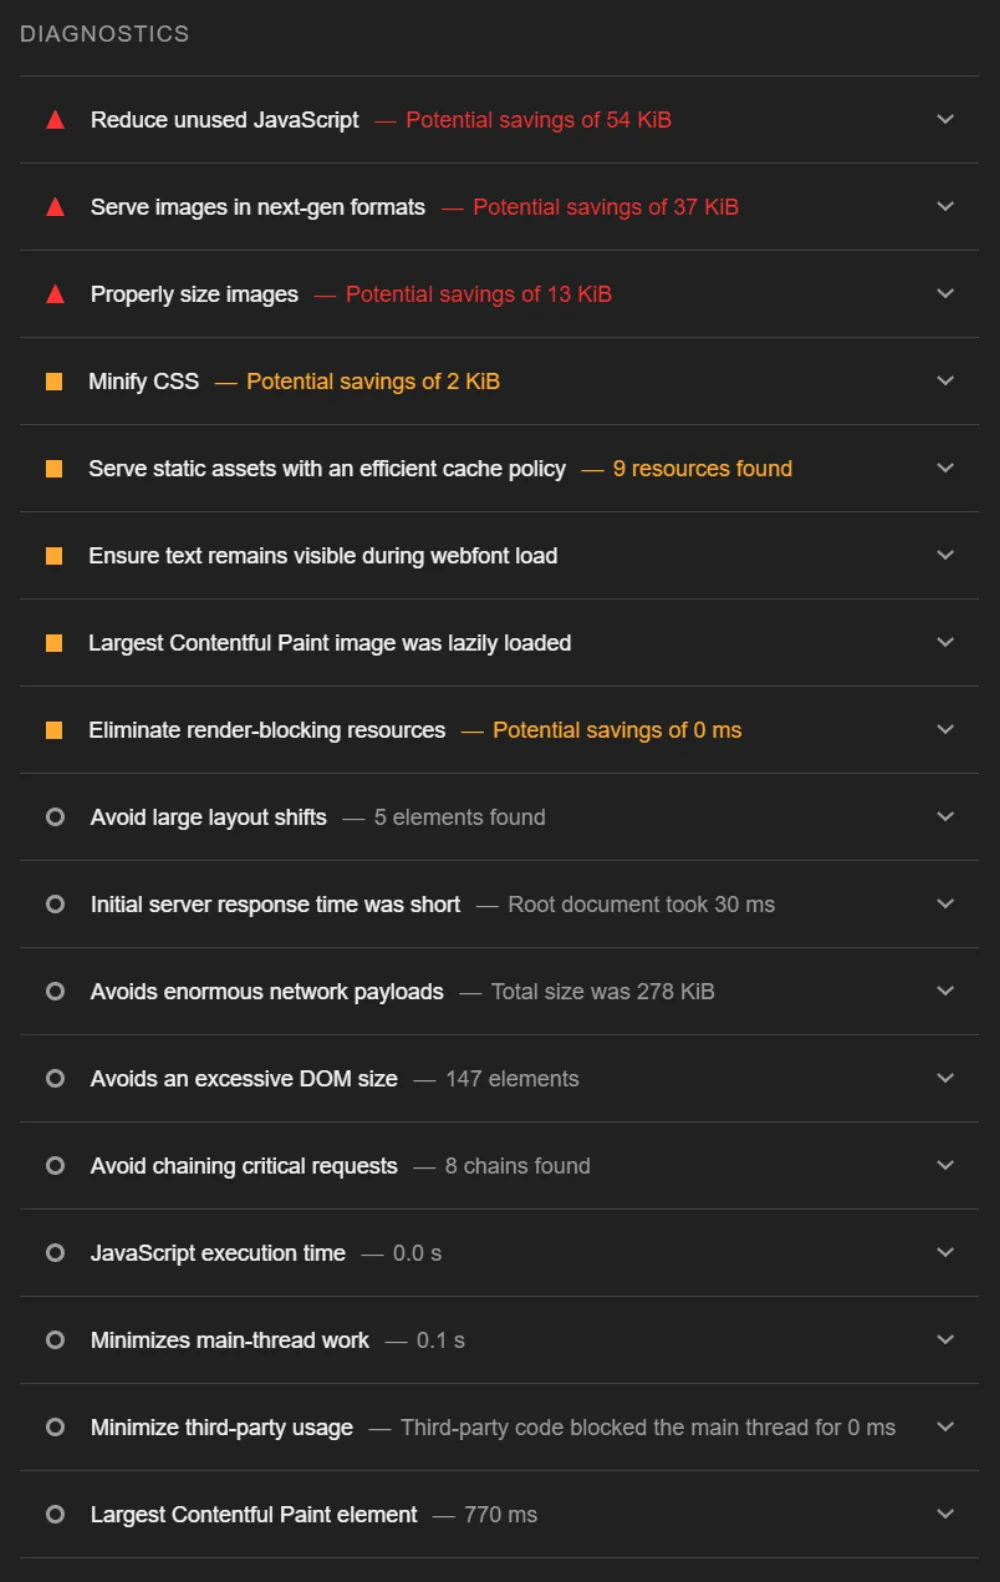
The red you see here isn’t enough to lower the score and will most likely save milliseconds off of page load, which we are OK with, for now. In the future as the site gets more content and media heavy, these areas may be worth addressing.
Each line under Diagnostics will detail the problem, any potential savings in site size or load speed, and provide a drop down for advice on how to fix them. Let’s look at the first line where it is telling us to Reduce unused JavaScript.
Each line under Diagnostics will detail the problem, any potential savings in site size or load speed, and provide a drop down for advice on how to fix them. Let’s look at the first line where it is telling us to Reduce unused JavaScript.

Clicking on the arrow to the right will reveal the full details of the issue, as well as how to fix them.
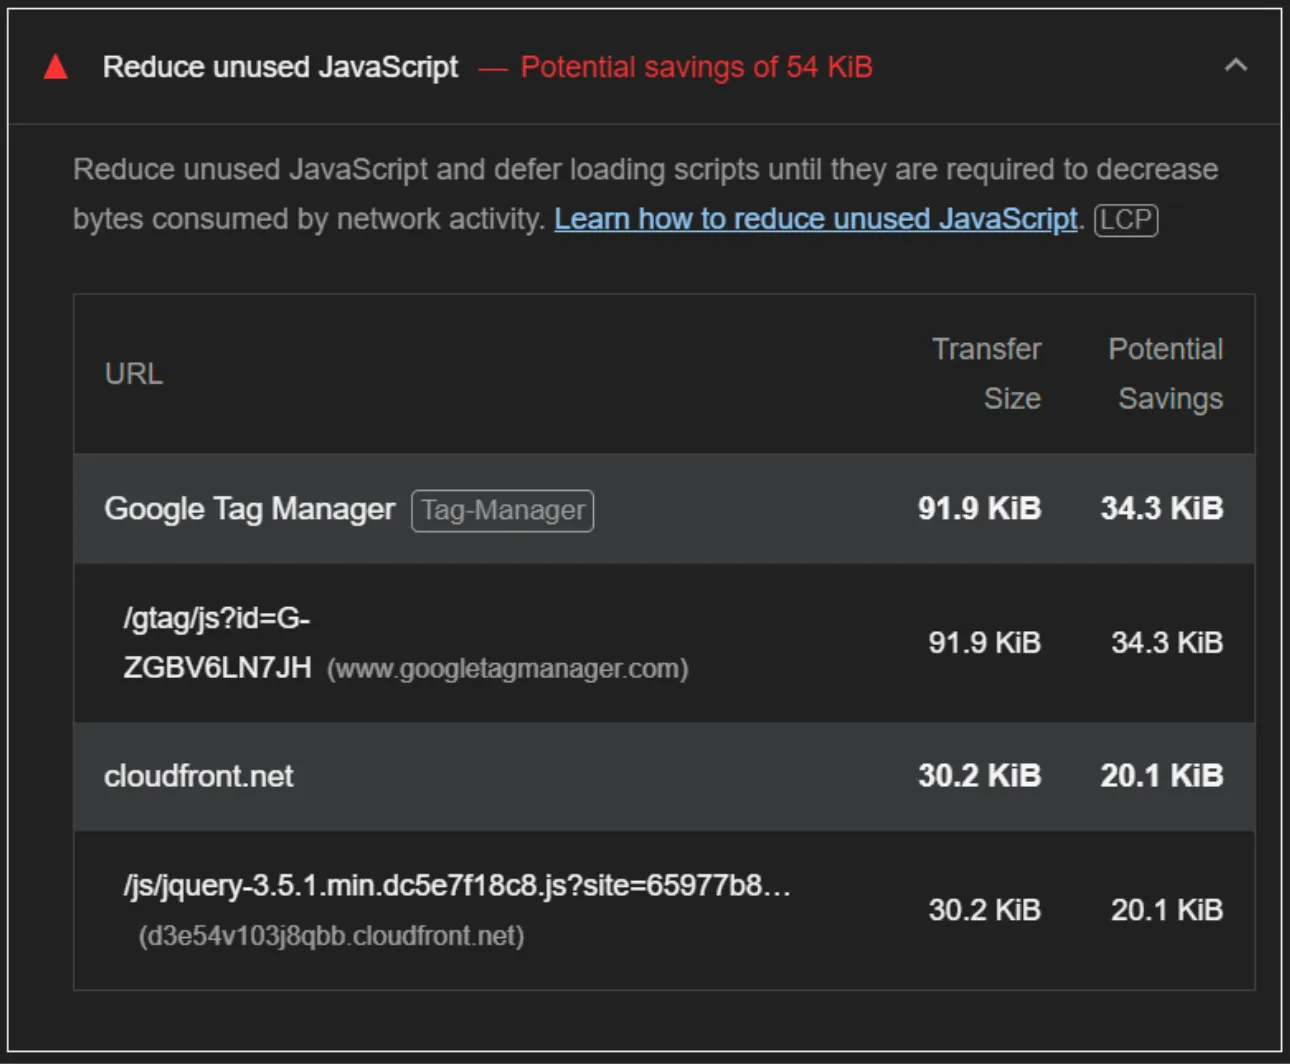
You will see a link is provided to teach you how to fix the issue, with a breakdown of the problematic code, and the Potential Savings if resolved. Again, as of today, these are so miniscule with the speed internet users have today, we won’t jump into fixing these yet. As the site grows and uses more JavaScript, new issues may arise or the existing code may increase to an unacceptable level that lowers the Performance score of the site; then we will look at how to resolve them to stay GREEN.
I encourage you to scroll down the rest of the report to discover any issues that need resolving to get all of your scores GREEN and your site winning!
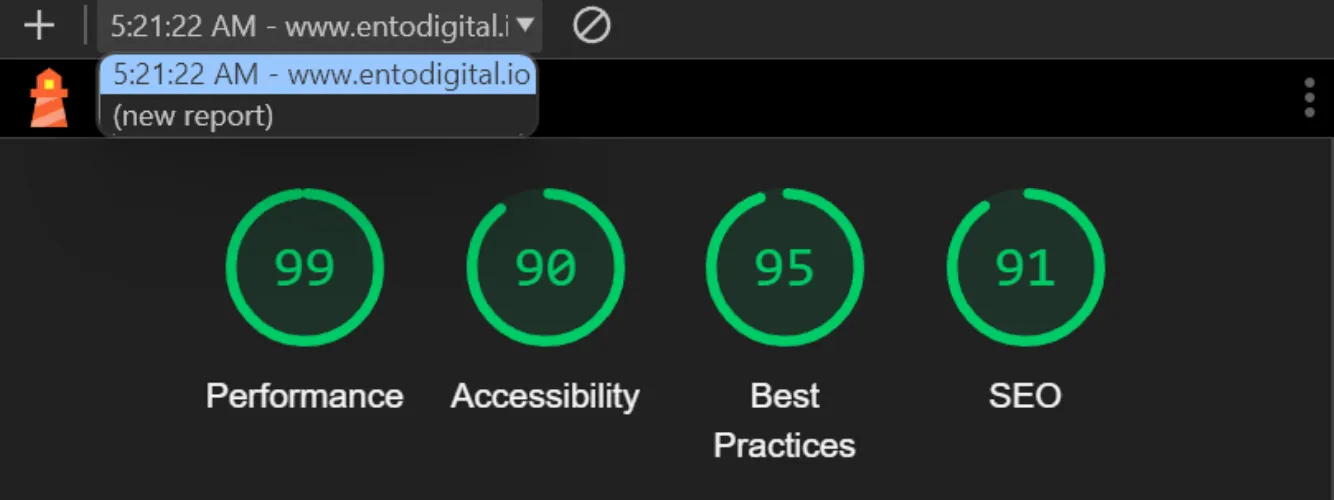
6. Once you are done with your Desktop report, it is time to get one for Mobile (where most of your site's visitors will be coming from). Scroll back to the top and click the down arrow next to your URL like in my example below, and click on (new report):
I encourage you to scroll down the rest of the report to discover any issues that need resolving to get all of your scores GREEN and your site winning!
6. Once you are done with your Desktop report, it is time to get one for Mobile (where most of your site's visitors will be coming from). Scroll back to the top and click the down arrow next to your URL like in my example below, and click on (new report):
You will return to the opening menu of Lighthouse. This time, click Mobile, and then Analyze page load to get your Mobile analytics report.
Uh oh, the SEO score has gone down to 87…
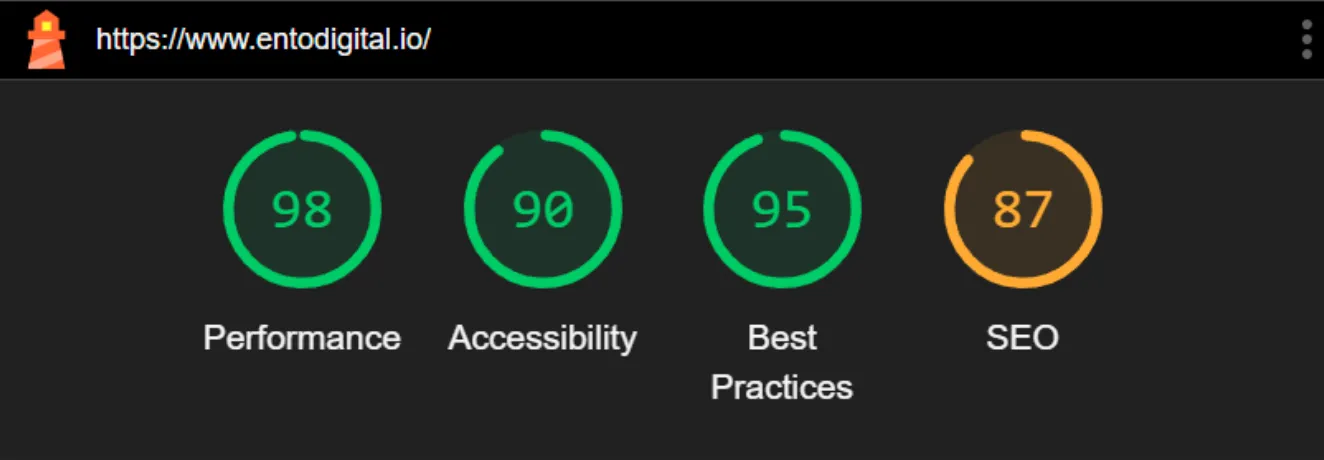
Let’s see what the report says:
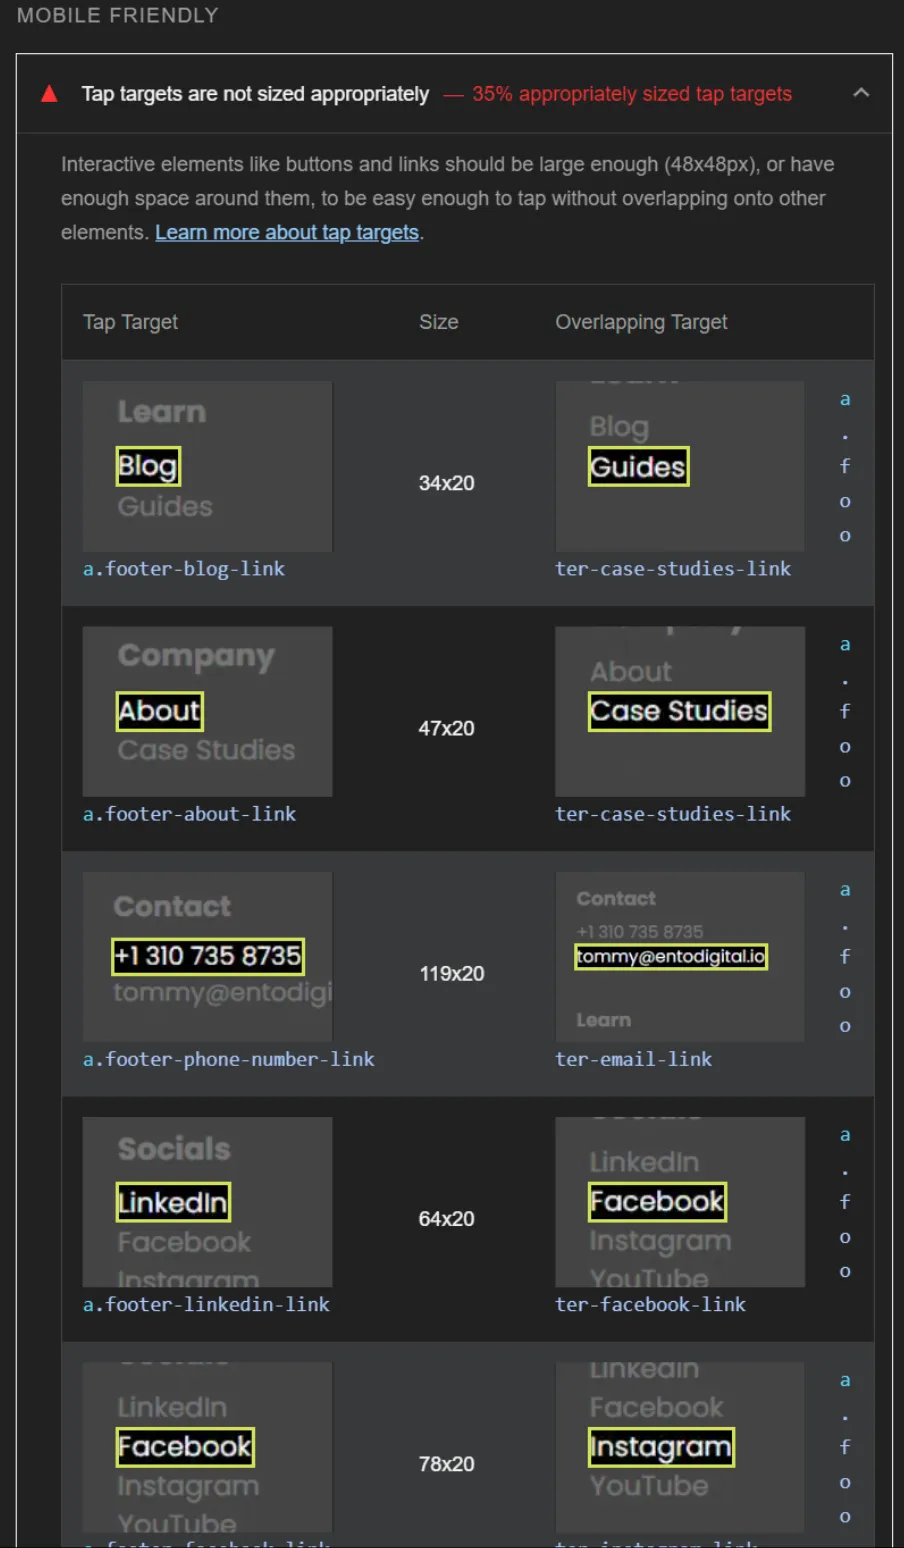
Hmmm, it is saying the links in our footer are too small for mobile and need more space for users to click on. Now, as a web designer with a Product Design background, I have to disagree with this falling under SEO as it is clearly an Accessibility issue (the site is harder to access if users have to pinch and zoom to properly click links).
It is still an issue to work on though, and moves will be made to remedy this even though testers didn't have issues on multiple devices before launch. We still need to make Google happy to increase the site's ranking.
The report tells us everything that is needed, and as the designer of the site, we can quickly go in and make these changes so everyone will be happy!
Et voila! There we have it! Now you know how to use Google’s Lighthouse to get a report that is a great starting point to getting your site in the GREEN and ranking on Google (but MOST of all, making sure your site's visitors have no frustrations).
We know this will be valuable to many people out there who may not have know that this tool exists right in their browser. If you need someone to build a site with all GREEN scores or to fix elements on your existing website, get in touch with EntoDigital today!
See you in the next guide!
Get in touch today to get your company or brand website ranking!
Schedule a call with us now to discuss your business and develop a winning strategy that we can immediately put into action.
Get My Free Web and SEO Audit
Get Updates and Free Advice
Subscribe to get updates on deals, advice, and more to get your company winning online.
Get Updates and Free Advice
© 2024 Website Design and SEO by EntoDigital. All Rights Reserved